Twitter feed is not available at the moment.
 

Thank you very much for your interest in our maps

Both digital and physical versions of the maps are available for free from GIE. We only charge shipping fees for physical versions.

Please read the following notes carefully before starting the ordering process:

  • Online orders can only be placed by entities with a valid VAT number. If you do not have a VAT number, please contact gie@gie.eu and the GIE secretariat will be pleased to arrange shipment for you.
  • Packing and shipping costs will be charged depending on the destination:
    • European Union: 28 EUR
    • Other Europe *: 38 EUR
    • United States: 58 EUR
    • For other countries outside Europe: 78 EUR
  • These orders can only be paid by credit card (VISA, MasterCard, American Express) and will be immediately processed.
  • Each shipment/order can contain up to 15 maps.
  • The shipping is done within 5 working days after order/payment.

Maps are also available at GIE Offices in Brussels, should you wish to collect them in person, please do not use the order form but contact us at gie@gie.eu .

All prices mentioned are in EUR and do not include VAT .

Are you a GIE member?

If so, please contact gie@gie.eu to receive a coupon for free shipping for one order (composed of maximum 15 maps).


* Other Europe includes the following countries: Andorra, Bosnia-Herzegovina, Kosovo, Liechtenstein, Macedonia, Monaco, Montenegro, Norway, San Marino, Serbia, Switzerland.

  •  

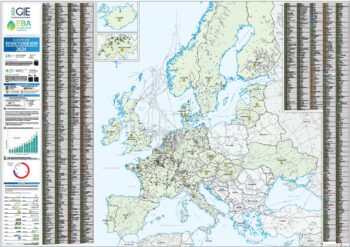
    European Biomethane Map

    This comprehensive map locates and lists all known biomethane installations in Europe. It has been produced with the information gathered from national biogas associations, energy agencies and companies.

    The Biomethane Map is the result of an ongoing collaboration between the European Biogas Association (EBA) and GIE, promoting the development of renewable gases. The map has been built with the support of EBA members, who have provided the necessary data, and the EBA Secretariat.

    This is the fifth edition of the map. Data sources of each country are listed on the map. Data covers active facilities under operation, according to the available data by June 2024. A full elaboration of the biogas and biomethane markets is available in the EBA statistical report.

    Europe reaches a total of 1,548 biomethane producing facilities by June 2024. Compared to the previous editions of the European Biomethane map, the number of plants in Europe has steeply increased (483 plants in the 2018 edition, 729 in the 2020 edition, 1,023 in the 2021 edition and 1,322 in the 2022-23 edition).

    Additional information

    Additional information

    Version

    July 2024

    Updates

    Annual

    Format

    A0

    Dimensions

    1189 x 841mm

    Process

    Quadri color offset print

    Paper options

    250g glossy paper with glossy lamination on one side

    Finishing options

    Plano (rolled)

    Packaging

    Delivered in cardboard box

    Add to cart
  •  

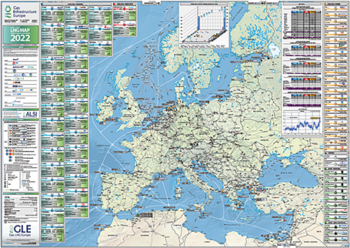
    GIE LNG Map

    The GIE LNG Map provides comprehensive information on existing and under construction LNG Terminals in Europe, including send-out capacity, LNG storage capacity and the main terminal characteristics. Planned or under study LNG terminals projects are also detailed.

    The LNG map is updated annually with first-hand information provided by GLE members making it a reliable source of information for the LNG business

    Maps are available free of charge, but we do need to charge shipping costs.

    Additional information

    Version

    November 2022

    Updates

    Annual

    Format

    A0

    Dimensions

    1189 x 841mm

    Process

    Quadri color offset print

    Paper options

    250g glossy paper with glossy lamination on one side

    Finishing options

    Plano (rolled)

    Packaging

    Delivered in cardboard box

    Add to cart
  •  

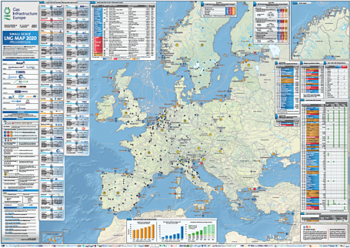
    GIE Small Scale LNG Map

    The 2020 edition of the GIE Small scale LNG map provides an updated overview as comprehensive as possible of the LNG infrastructures (large scale and small scale) offering LNG small-scale services in Europe.

    The display has also been improved, in particular with specific tables, to make the readability even more user friendly.

    Data shows that LNG infrastructures offering LNG small-scale services are continuing to develop strongly throughout Europe, thus allowing further development of LNG whether as fuel in maritime and heavy road transport or as off-grid energy solution.

    • For road transport, the existing trend has been confirmed: there are now about 280 LNG fuelling stations in operation, while the milestone of the 200th station was reached just one year ago.
    • For ships bunkering, the progress is even more striking: there are now 9 vessels dedicated to LNG bunkering, with 5 more expected to be delivered by the end of 2020, while three years ago there were only 2.
    • Supplying industrial sites not connected to the gas grid is another expanding major usage of small-scale LNG.

    Infrastructures offering small scale services expand the geographic availability of small-scale LNG onshore, on inland waterways or at sea. Related services are now or will soon be available in nearly all large-scale terminals, new projects of small-scale LNG terminals and small-scale liquefaction plants are also developing in more and more countries.

    Moreover, an additional step allowing the energy transition has been taken: Liquid biomethane production plants are developing in several European countries.

    LNG is an very attractive alternative to heavy fuel oil and diesel in freight transport and shipping, as well as in supply of off-grid sites, thanks to its superior environmental performance (up to 25% less CO2, up to 90% less NOx, negligible quantity sulphur and fine particulates).

    The rapid growth of small-scale LNG illustrates its potential to pave the way to a greener energy future.

    Download press release

    Additional information

    Version

    June 2020

    Updates

    Bi-annual

    Format

    A0

    Dimensions

    1189 x 841mm

    Process

    Quadri color offset print

    Paper options

    250g glossy paper with glossy lamination on one side

    Finishing options

    Plano (rolled)

    Packaging

    Delivered in cardboard box

    Sold Out - please contact gie@gie.eu

  •  

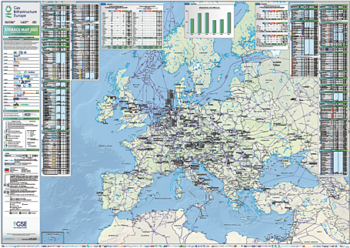
    GIE Storage Map

    The GIE Storage Map provides comprehensive information on existing and under construction underground gas storage facilities in Europe, including working gas volume, withdrawal and injection capacity as well as other main characteristics. Planned or under study storage projects are also detailed.

    The Storage Map is updated every second year with first-hand information provided by GSE members making it a reliable source of information for the Storage business.

    The new initiative builds on the work done by ENTSOG in the area of Ten-Year Network Development Plan (TYNDP) and Winter and Summer Supply Outlooks as well as on the transparency initiatives developed by Gas Storage Europe (GSE) and Gas LNG Europe (GLE).

    The map series aims at providing a compact and regular overview of existing gas infrastructure and outlook for its development as well as of actual supply and demand situation at both the European and national level from the perspective of a respective year. It aims at establishing an easy reference for such information and at mapping trends and their development over time. As such it contributes to enhanced transparency of the gas market.

    Additional information

    Version

    July 2021

    Updates

    Bi-annual

    Format

    A0

    Dimensions

    1189 x 841mm

    Process

    Quadri color offset print

    Paper options

    250g glossy paper with glossy lamination on one side

    Finishing options

    Plano (rolled)

    Packaging

    Delivered in cardboard box

    Add to cart
  •  

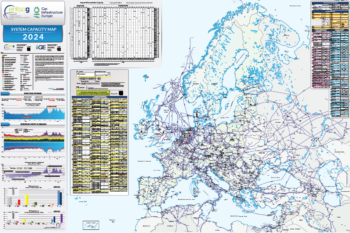
    System Capacity Map

    The System Capacity map illustrates the latest European gas infrastructure and capacities, providing useful gas market data for enhanced transparency. Historical data on gas demand and supply at European level from the latest Summer and Winter Review Reports are presented aggregated in the form of charts. The map also presents import and transmission capacity data as of date of publication. Information regarding the gas storage fill rate and LNG capacities shown were obtained from the GIE AGSI and ALSI platforms respectively.

    This map is published jointly with ENTSOG.

    The System Capacity map was first published in 2024 and combines the information from the former System Development and Transmission Capacity maps.

    Additional information

    Version

    2024

    Updates

    Annual

    Format

    XXL

    Dimensions

    1600 x 1200mm

    Process

    Quadri color offset print

    Paper options

    250g glossy paper with glossy lamination on one side

    Finishing options

    Plano (rolled)

    Packaging

    Delivered in cardboard box

    Add to cart